Overview
- Introduction
- Thresholding
- Segmentation
- Otsu's Method
- Edge Detection
- Canny Edge
- Outlook and Conclusion
3: Otsu's Method
Otsu's method is a commonly used algorithm to compute the ideal threshold-value for image-segmentation. It is used in cases where the image-histogram is bimodal (meaning it contains two distinct peaks) to find the ideal "middle ground".
We highly recommmend that you have a look at the original publication from 1975 regarding the algorithm (Access should be granted if you try to access it using the university internet).
3.1: Theory
Otsu's method works by maximizing the between class variance σB² which is defined as:
with
P1(θ) = $\sum_{i = 0}^{\theta} h(i)$ (≙ number of pixels below the threshold (background))
P2(θ) = 1 - P1(θ) = $\sum_{i = \theta +1}^{L-1} h(i)$ (≙ number of pixels above the threshold (foreground))
μ1(θ) = $\frac{1}{P1(\theta)}$ $\cdot$ $\sum_{i = 0}^{\theta} (i+1)h(i)$ (≙ mean intensity of the background)
μ2(θ) = $\frac{1}{P2(\theta)}$ $\cdot$ $\sum_{i = \theta +1}^{L-1} (i+1)h(i)$ (≙ mean intensity of the foreground)
with h(i) being the normalized histogram of the image, θ being the current threshold and L being the length of the histogram-array.
3.2: Coding
In order to implement this algorithm, you will need to:
- Generate the histogram of the image
- Use the histogram to determine P1(θ) and P2(θ) for all possible θ's
- Use these values to calculate μ1(θ) and μ2(θ) for all possible θ's
- Calculate σB² (θ) for all possible θ's
Moving foreward, these steps will be explained in further detail. Since your code for this task can get rather long, you should pay attention to an orderly programming style to avoid difficulties while debugging later on. You can also add comments to your code to help you keep track of your work.
To do:
- Open the
Task_3_Otsu-class and take note of the empty methods provided. Each of these methods will be performing one of the calculations detailed above.
-
Complete the method:
public double[] getHistogram(ImageProcessor in) {}a. Create a
double-array of appropriate size to store the histogram-valuesb. Iterate through the input-image and update the corresponding histogram-entry for each pixel's value
c. Normalize and return the histogram.
Normalizing refers to converting the histogram to a probability distribution. If you are unsure how to do that, have a look at the original publication
-
Complete the methods to compute P1(θ), P2(θ), μ1(θ) and μ2(θ):
public double[] getP1(double[] histogram){} public double[] getP2(double[] P1){} public double[] getMu1(double[] histogram, double[] P1){} public double[] getMu2(double[] histogram, double[] P2){}P1(θ) and P2(θ):
-
Consider which values for θ are possible in an 8-bit grayscale image
-
Iterate through the possible values of θ and calculate P1(θ) and P2(θ) for each instance
μ1(θ) and μ2(θ):
- Calculate the values for μ1(θ) and μ2(θ) according to the formulas provided above.
📝 Note:
Pay attention to the possibility of dividing by zero. You can handle this, by checking beforehand, if you will be dividing by zero and simply dividing by a very small number instead. We recommend you use 10e-10
-
- Determine the values for σB² (θ) in the method:
a. Create a newpublic double[] getSigmas(double[] P1, double[] P2, double[] mu1, double[] mu2) {}double-array of suitable length b. Calculate σB² (θ) for each value of θ and store it in the array you just created c. Return the array of sigmas
-
Find the maximum of your sigmas-array using:
public int getMaximum(double[] sigmas){}Determine the index (within the array of possible σ's) of the maximum value for σB² (θ) and store the index as an
int-variable (In case there is no definite maximum, you can simply select the σ with the highest index, as this adds the least amount of extra programming)The maximum value this method returns is your Otsu-Threshold-Value
-
Complete the method:
public ByteProcessor otsuSegmentation(ImageProcessor ip) {}This method will combine all the steps for calculating the Otsu-Threshold, as well as return the Image after having applied the Otsu-Threshold and print the determined value to the terminal.
a. First apply an illumnation-correction to the input image. To do this, inherit the methods you implemented in Task_1 by using:
Task_1_Threshold Threshold = new Task_1_Threshold();You can call methods belonging to the Threshold-Object like this:
Threshold.correctIllumination().b. Use the "illumination-corrected" image to perform all of the calculations you implemented
c. Apply a Thresholding-operation to your image using the determined Otsu-Threshold and store the result in a ByteProcessor.
d. Print the Otsu-Threshold to the terminal and return the result-ByteProcessor
-
Complete the
run-method such that it applies the Otsu-Segmentation-Process to the Input-Image and displays the resulting image.
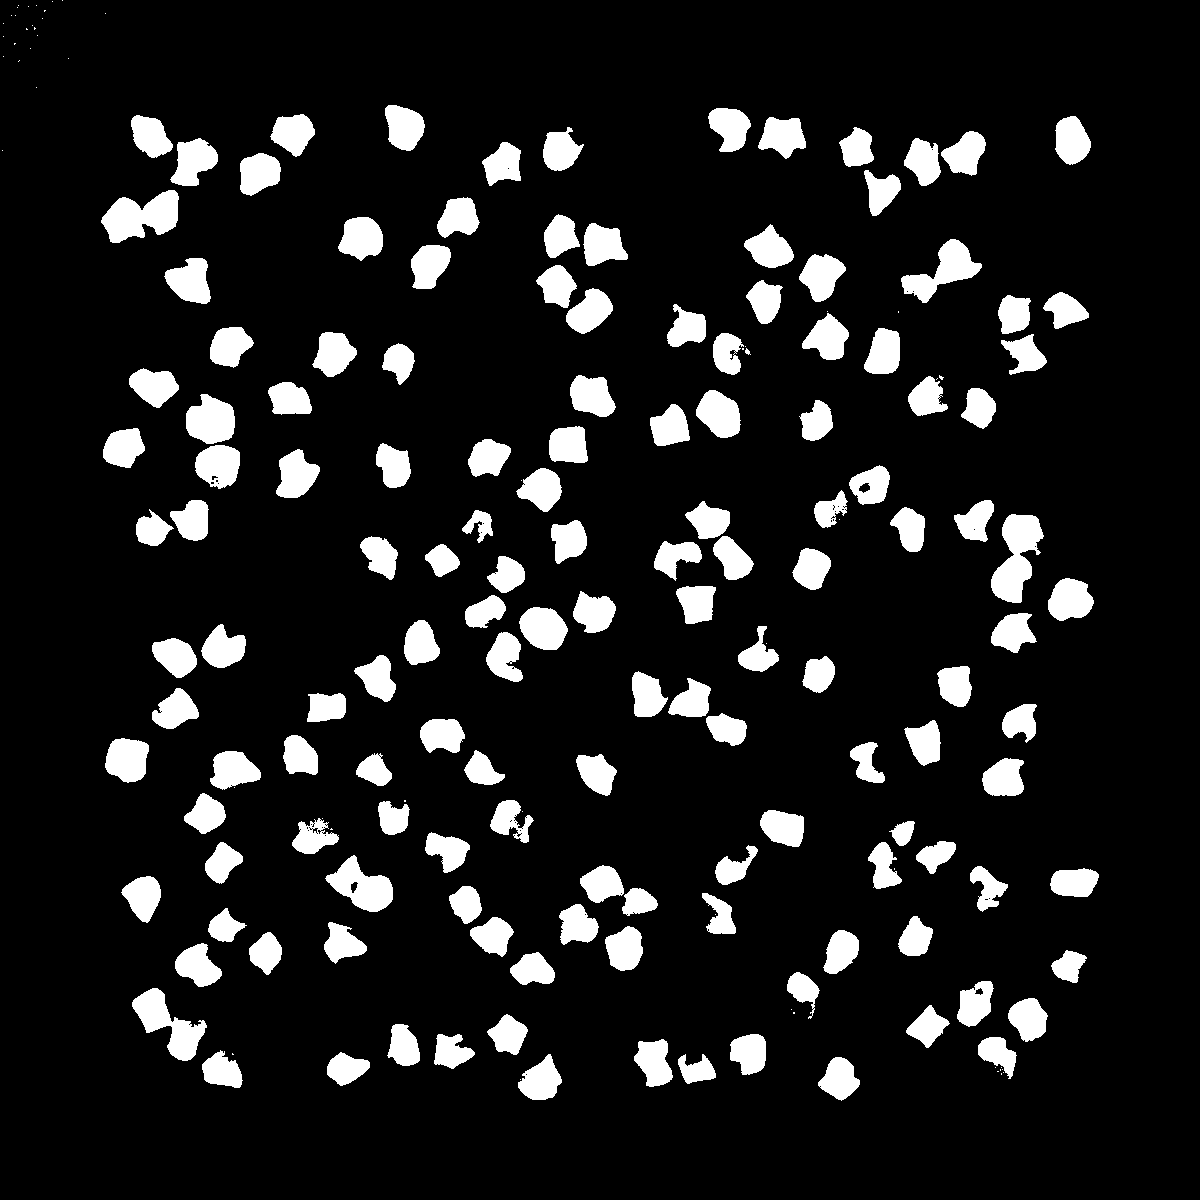
To check your code you can perform an Otsu-Segmentation of the "Cells"-image. Your plugin should return the following:

3.3: Project-Report
The part of your report concerning Task_3 should contain the following:
- A brief explanation of what Otsu's method is
- What it aims to achieve and how
- Its limitations
- Example of your segmentation
- In the original publication, Otsu mentions that "An optimal threshold is selected automatically and stably, not based on the differentiation (i.e. a local property such as valley), but on the integration (i.e., a global property) of the histogram." Explain what this means, especially where the integration comes from.
- Compare the results to the naive thresholding method
- Otsu's method, while still applied and useful in practice, has several shortcomings. Discuss two of them and name examples of current methods that can be applied to similar problems that solve these issues, by providing a citation and briefly explaining them.
